1
2
3
4
5
6
7
8
9
10
11
12
13
14
15
16
17
18
19
20
21
22
23
24
25
26
27
28
29
30
31
32
33
34
35
36
37
38
39
40
41
42
43
44
45
46
47
48
49
50
51
52
53
54
55
56
57
58
59
60
61
62
63
64
65
66
67
68
69
70
71
72
73
74
75
76
77
78
79
80
81
82
83
84
85
86
87
| clear all;
close all;
clc;
[y,fs] = audioread('音频文件路径');
y0 = y(:,1);
wpl = 0.2*pi;
wph = 0.75*pi;
wsl = 0.35*pi;
wsh = 0.85*pi;
Fs = 8000;
Rp = 1;
As = 100;
T = 1/Fs;
omepl = 2/T*tan(wpl/2);
omesl = 2/T*tan(wsl/2);
omesh = 2/T*tan(wsh/2);
omeph = 2/T*tan(wph/2);
Bp = omeph - omepl;
omep0 = sqrt(omepl*omeph);
omesl_ = ((omesl^2)-(omep0^2))/(omesl*Bp);
omesh_ = ((omesh^2)-(omep0^2))/(omesh*Bp);
omepl_ = ((omepl^2)-(omep0^2))/(omesh*Bp);
omeph_ = ((omeph^2)-(omep0^2))/(omeph*Bp);
if abs(omesh_)>abs(omesl_)
omes_ = abs(omesl_);
else
omes_ = abs(omesh_);
end
omeap_ = 1;
[N,wc] = buttord(omeap_,omes_,Rp,As,'s');
[Z,P,K] = buttap(N);
[bLP,aLP] = zp2tf(Z,P,K);
[bBP,aBP] = lp2bp(bLP,aLP,omep0,Bp);
[b,a] = bilinear(bBP,aBP,Fs);
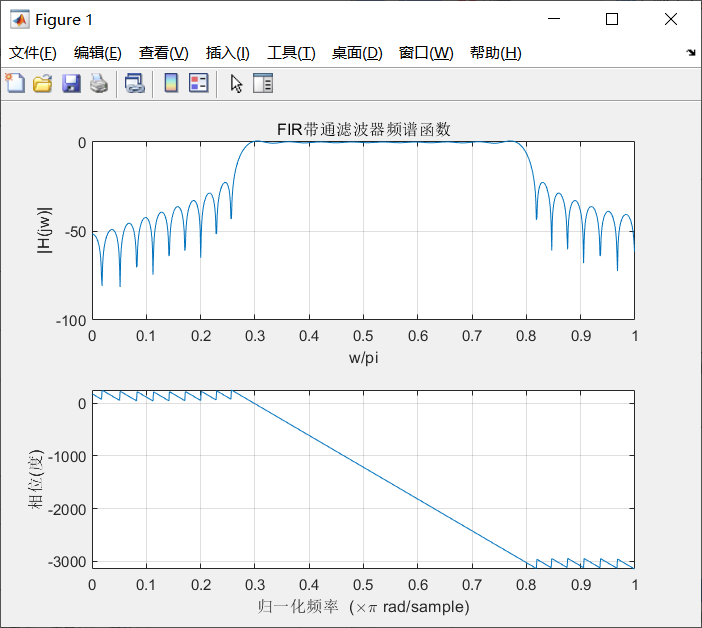
w = linspace(0,pi,100000);
H = freqz(b,a,w);
y1 = filter(b,a,y0);
Y0 = fft(y0);
Y1 = fft(y1);
sound(y1,fs);
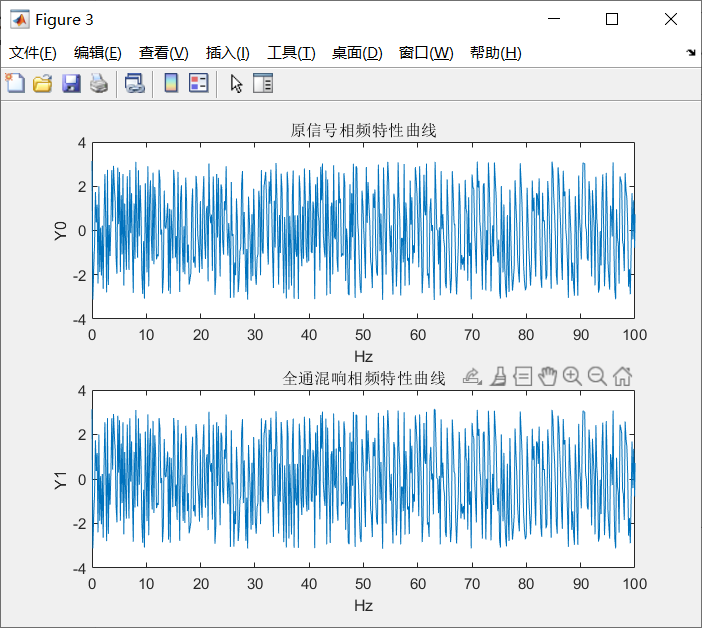
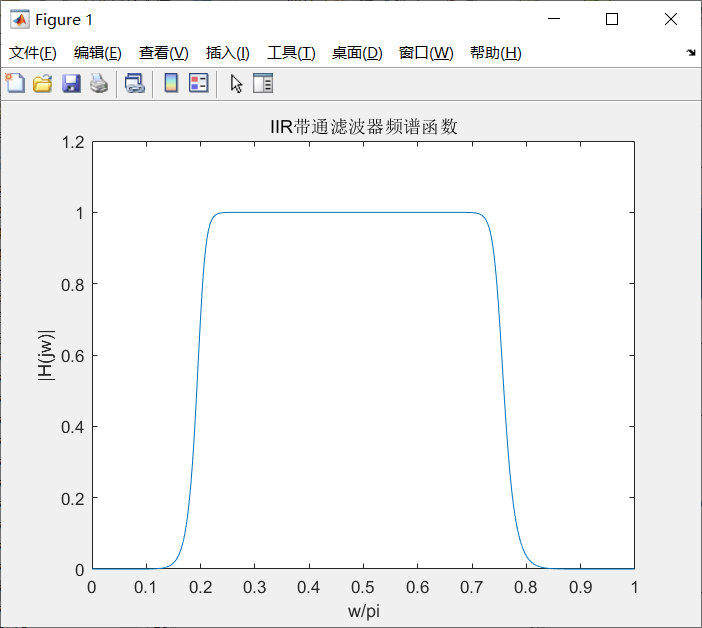
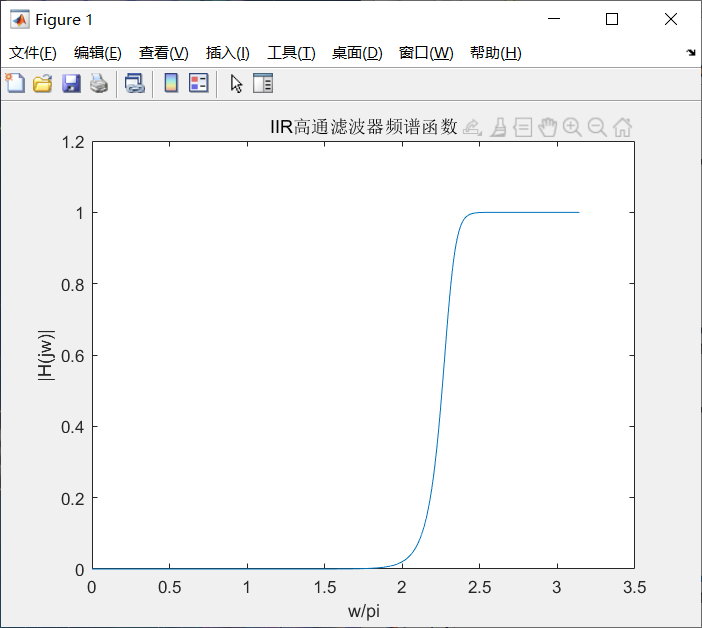
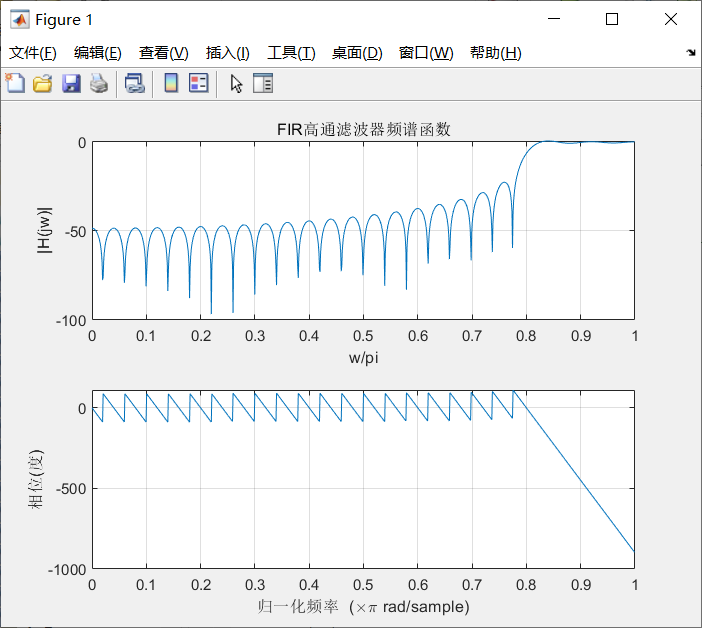
figure(1);
plot(w,abs(H));
xlabel('w/pi');
ylabel('H(jw)');
title('IIR带通滤波器频谱函数');
dt = 1/fs;
audiolen = length(y0);
n = 0:audiolen-1;
t = n*dt;
audiolen1 = length(y1);
n1 = 0:audiolen1-1;
t1 = n1*dt;
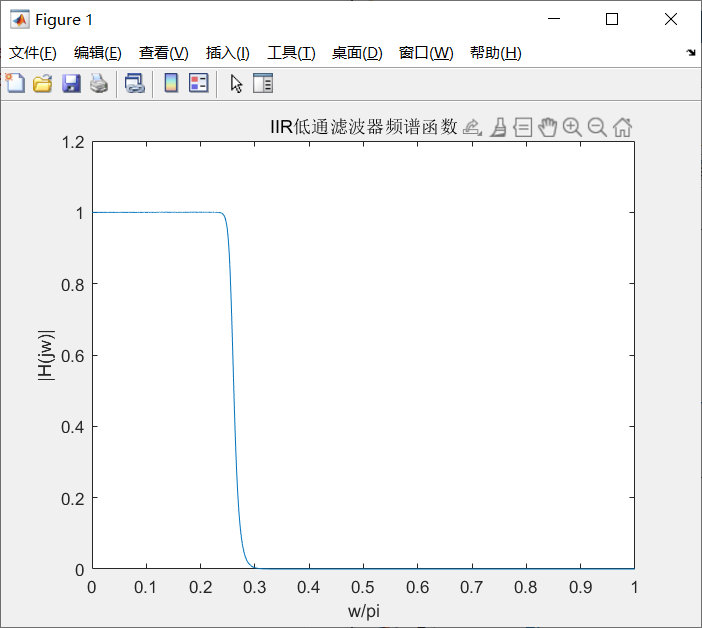
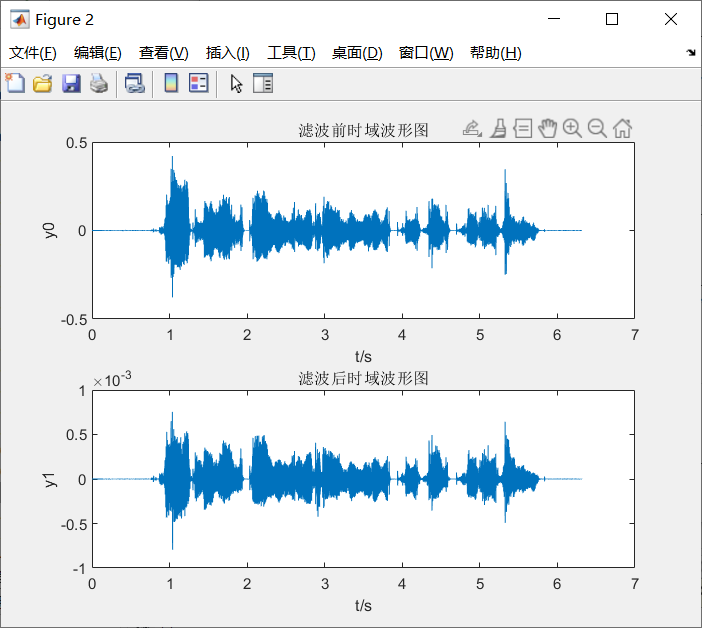
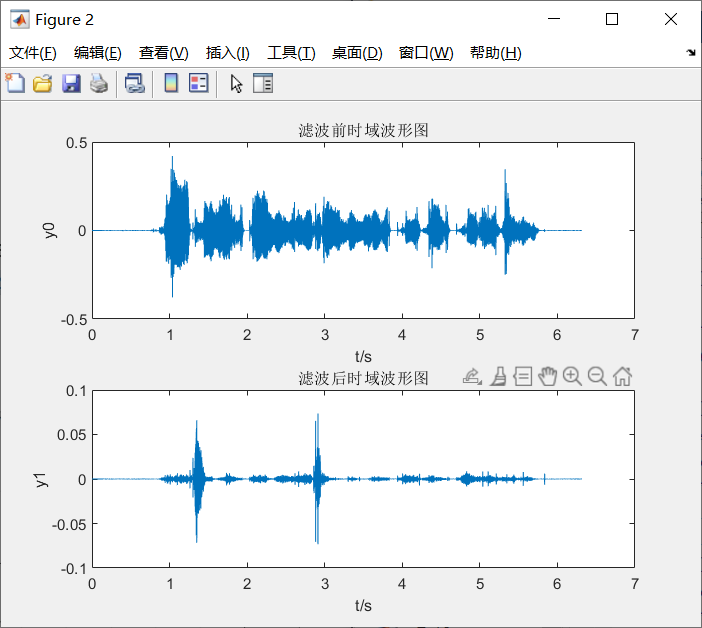
figure(2);
subplot(2,1,1);
plot(t,y0);
xlabel('t/s');
ylabel('y0');
title('滤波前时域波形图');
subplot(2,1,2);
plot(t1,y1);
xlabel('t/s');
ylabel('y1');
title('滤波后时域波形图');
df = fs/audiolen;
f = (0:audiolen-1)*df;
df1 = fs/audiolen1;
f1 = (0:audiolen1-1)*df1;
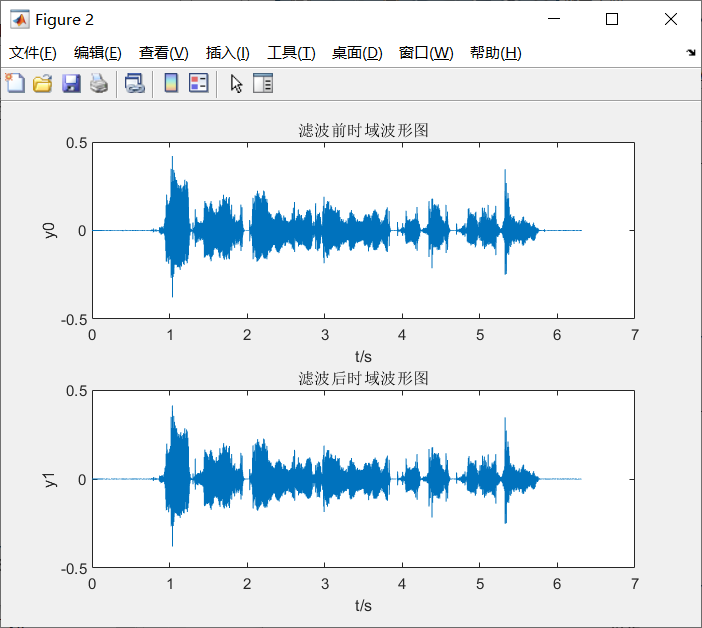
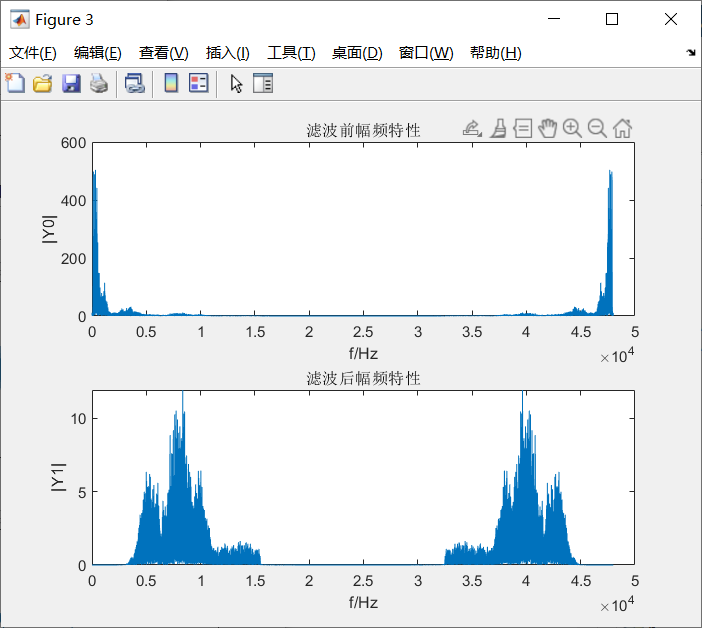
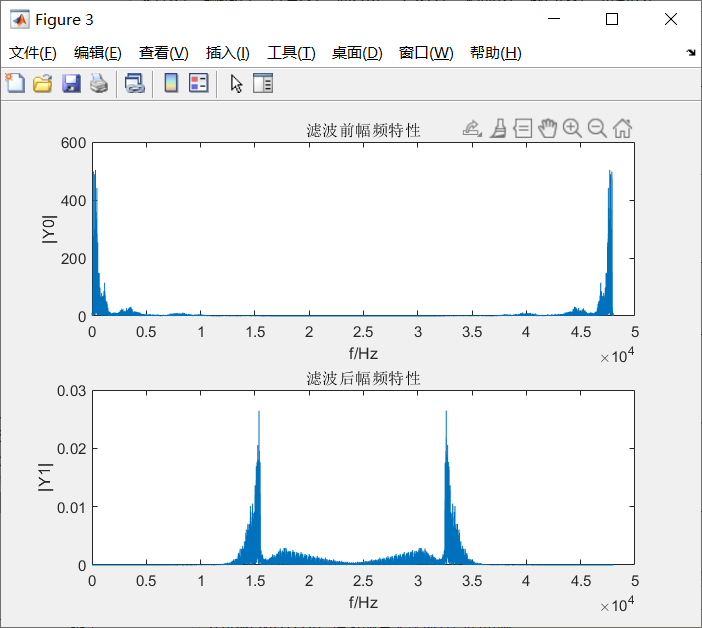
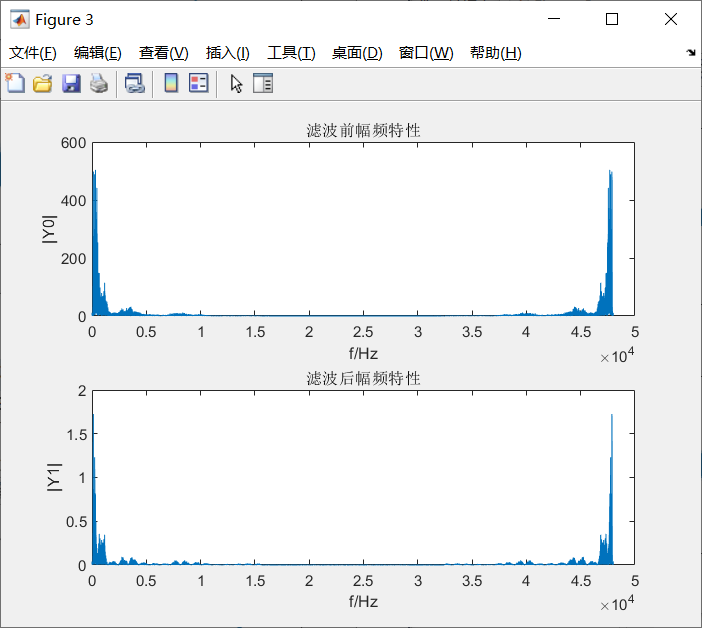
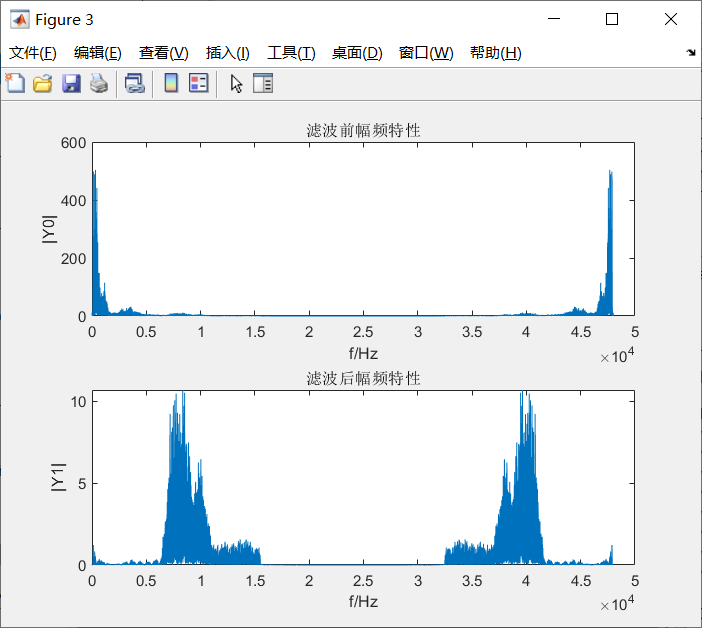
figure(3);
subplot(2,1,1);
plot(f,abs(Y0));
xlabel('f/Hz');
ylabel('Y0');
title('滤波前幅频特性');
subplot(2,1,2);
plot(f1,abs(Y1));
xlabel('f/Hz');
ylabel('Y1');
title('滤波后幅频特性');
|